Recently I came across the IBM Data Science Professional Certificate set of courses on Coursera and I wanted to brush up my data science knowledge. I had taken a similar series of courses some six years ago and the first thing I noticed this time is how much the field has advanced.
Six years ago, the language of choice was R, which I never really embraced, mostly because I saw it as an archaic language that has no business in the 21st century. I’m really happy that nowadays it appears that python is the language of choice. I love python, and this is definitely one of the reasons why I enjoyed doing this set of courses.
Next topic is Pandas. I hate dataframes. As an SQL person, I find it frustrating that I can’t just simply select and group by and join tables using syntax that comes off the top of my head in seconds. With dataframes, I struggle to do even the simplest operations, such as replacing the values in a column based on a simple formula. Of course, I have learned how to do it using Pandas, but still I find it so frustrating that instead of doing it quickly in SQL, I have to go to the documentation and try to figure out how to do it in Pandas, especially since there is always more than one way to do it. But I guess it will just take more time and practice, until I learn to work with dataframes with the same efficiency that I work with SQL.
Similarly, visualization using pyplot is so much more time consuming (and the result is not as pretty) than doing charts in Excel where I know exactly how to do what I want with a few clicks. Doing charts with pyplot is just as frustrating as having to use Padas dataframes instead of SQL because of having to go to the documentation to figure out how to do something each time I need a simple chart.
Battle of Neighborhoods
For our final project as part of the IBM Data Science Professional Certificate we were asked to come up with an analysis using Foursquare API. I have to say that I didn’t quite grasp the real-world aspect of this exercise, I still see this project as an educational tool to strengthen what we learned in the courses. Perhaps I can’t find meaning in it because I’m not familiar with Foursquare since I don’t use it personally (if we had to do something similar using TripAdvisor data I might have felt differently because I actually use TripAdvisor on a regular basis). Or perhaps it is because Foursquare doesn’t have much data around the city where I live, which is Ljubljana, Slovenia.
I decided to analyze data in Toronto, Canada which we used in one of the previous exercises since I felt that it doesn’t matter one way or another what city I choose, the exercise would be the same. The idea of the exercise is as follows:
- Get a list of neighborhoods in your chosen city, by scraping a Wikipedia page, for example
- Get the geographical coordinates of each neighborhood; one way of doing this could be to use the geolocator library, another way would be to scrape a list that someone has already provided
- Use the geographical coordinates of each neighborhood and pass them one by one to the Foursquare API, which returns a list of venues in the neighborhood within a given radius
- Perform k-means clustering on the neighborhood venues data to cluster neighborhoods into groups that are similar by venue type
- Find something useful to do with these clusters, such as to identify preferred neighborhoods where to open a particular type of restaurant, or – what I chose to do in my project – to identify residential neighborhoods where a family with school age children might want to live
We have to understand that Foursquare API provides crowd-sourced data and as a consequence, the data is quite messy, often incomplete and sparse in areas where Foursquare is not popular. I found that Toronto doesn’t have as much Foursquare data as New York, which was used as a case study in one of the courses.
With Toronto data, I decided to exclude neighborhoods with fewer than 4 venue categories from my analysis. It just doesn’t make sense to perform analysis on sparse data because when you have just a few data points, when you add one more, it has a significant effect on the resulting analysis. However, when you have many data points, for example in hundreds or even thousands, then one additional data point doesn’t have so much influence. I understand that clustering neighborhoods is something that should be stable over time because new venues, such as restaurants, shops, hotels or sporting stadiums don’t just appear overnight. Neighborhoods have their own character and lifestyle that doesn’t change in the short term. But Foursquare doesn’t provide data about all the venues in a neighborhood, only those for which some user has decided that they deserve attention.
As I was working on the project, I ran and re-ran my analysis many times and I got slightly different results for my resulting clusters each time I refreshed the data. After I decided to exclude neighborhoods with sparse data, I saw that results were much more stable, meaning that I came up with similar clusters even when I ran the analysis over and over again (results do not come up exactly the same every time because k-means clustering uses random initial cluster segments which does account for different results every time).
Results
I don’t want to go into too much detail about all the technical aspects of my project because I have a Jupyter notebook with the complete code and a document explaining what I did.
In short, I gathered a list of Toronto neighborhoods with their geographical coordinates and then retrieved the venues and venue categories in each neighborhood using Foursquare API. I cleaned and rearranged the resulting data and performed k-means clustering to arrive at clusters of neighborhoods with similar venue categories. I visualized the clusters using a Folium map, like this:
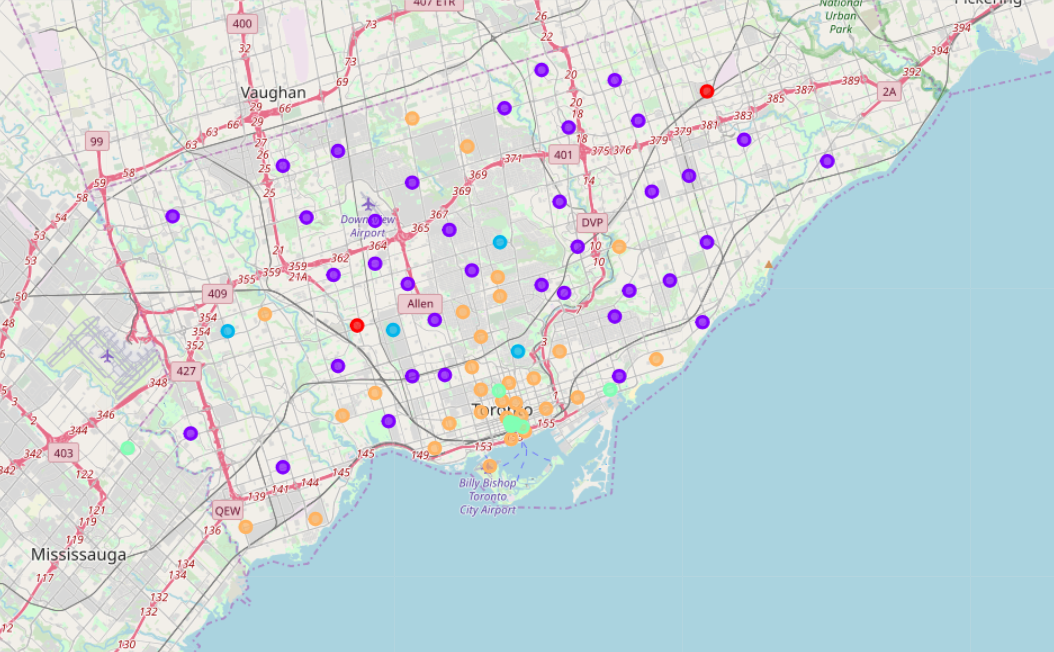
I tried to identify clusters of neighborhoods that would be suitable for families with children and based on the results of my analysis, I chose two clusters of neighborhoods, depicted purple and orange on the above map, because these neighborhoods are predominantly comprised of venue categories such as food, shopping and recreation.
To check my results I looked for online sources of lists of the the best neighborhoods for families with children and I decided to just go with a Google search and use the top blogs that came as a result of the search. Because these blogs were all unstructured data, I had to manually read each one and copy the neighborhood names into an Excel file and then assign them to the corresponding postal code. I superimposed these neighborhoods on the above map using markers, below is the resulting map:
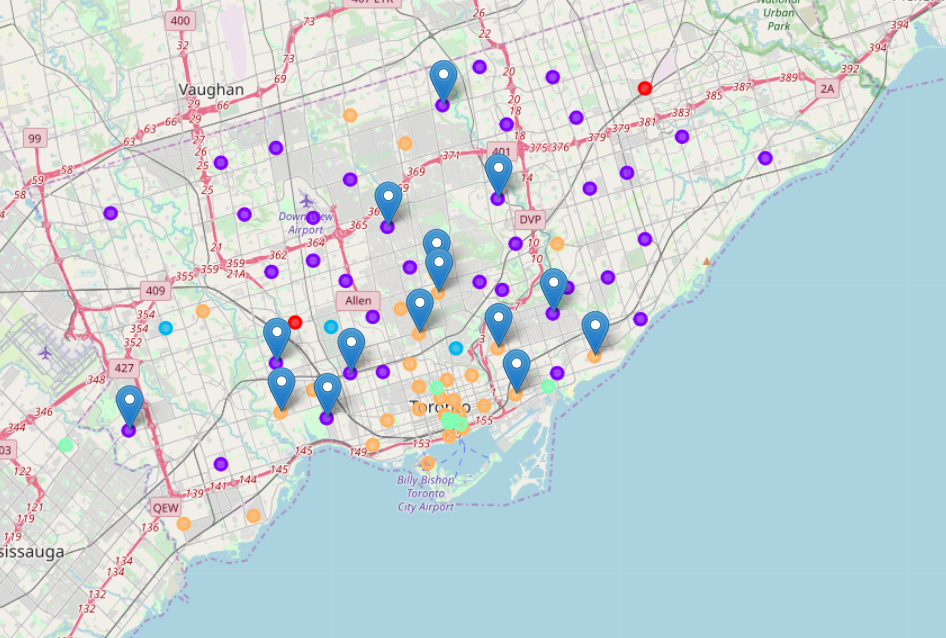
The result is that all of the suggested neighborhoods for families with children lie in the two clusters that I have identified as suitable for families with children.
What I learned
I absolutely enjoyed doing this set of courses. As already mentioned, I love python and was happy that I didn’t have use R. I love working with data, so gathering, cleaning and wrangling data that was used for the analysis was really in my comfort zone. I can definitely say that my understanding of Pandas is improving and creating diagrams using pyplot and Folium was not too frustrating. I’m getting better with markdown and Jupyter notebooks as well.
One aspect of the courses that in my opinion was not covered well enough is machine learning using various algorithms. Sure, we covered all the algorithms in class, but for something to really stick, we would have to do more practical exercises with each algorithm. The most difficult part is choosing the right model. With all the tools and libraries available, it is not much trouble to gather some data and apply one of the machine learning algorithms. But how do we know that the results of the model are any good? How can we improve the model? How do we know that the model predicts well if it is a predictive model or that clusters are stable if it is an unsupervised model? This is what data science is all about and this part could have been covered in more depth in the courses.
But overall, this is a great set of courses and definitely recommended.